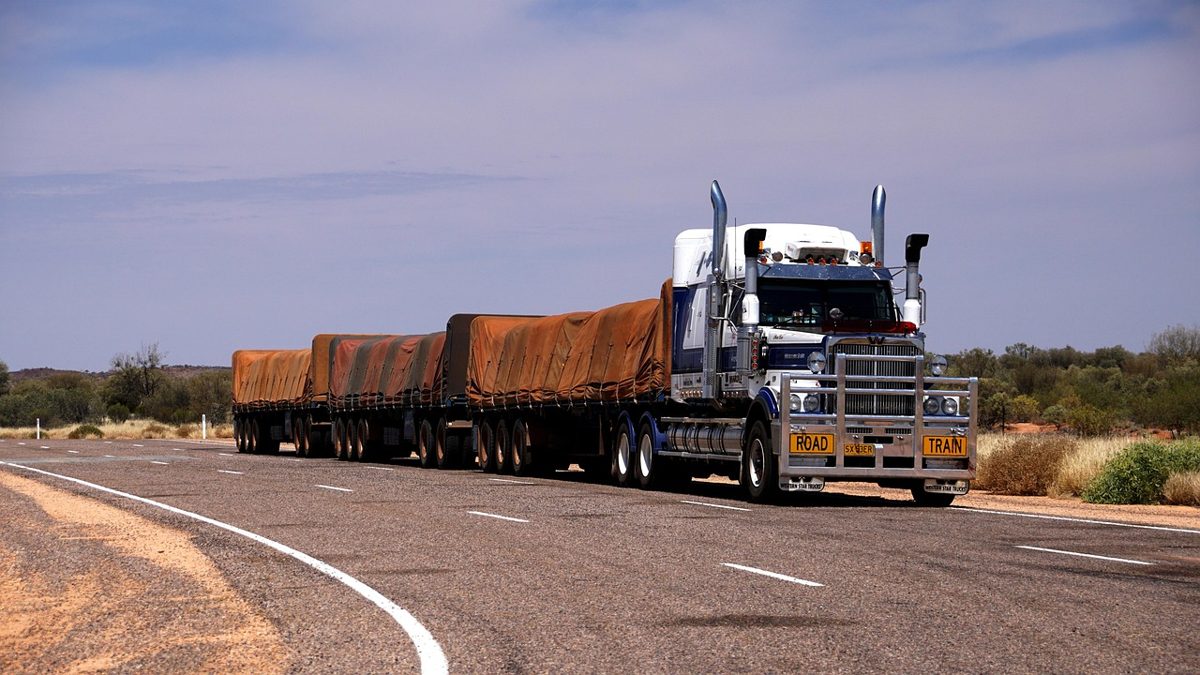
Diesel is $6.18 a gallon (+66.5% in a year). Consumer prices are up 4.0% over 12 months, food 2.7%. Diesel moves nearly every grocery item by truck, so a lasting rise tends to show up in food prices within months; shortages are rare because suppliers pass on the cost rather than stop shipping.
U.S. diesel, $/gallon (last 12 months), 2025-10-20 to 2026-10-12
Diesel and inflation
Measure
Latest
Change
Diesel ($/gal)
6.18
+66.5% (1 year)
CPI, all items
+4.0% (1 year)
CPI, food
+2.7% (1 year)
Truckers and grocers
Over the past month WMT led this group at +11.3%, while JBHT lagged at -3.4%.
No insider at these companies bought shares on the open market in the last 90 days.
Stock
Close
5 days
1 month
Insider buys 90d
Insider sells 90d
ODFL
$187.72
+3.2%
+7.2%
—
$4.0M
KNX
$64.81
+0.5%
-2.8%
—
$16.2M
JBHT
$228.78
-0.2%
-3.4%
—
—
KR
$63.63
+3.2%
+4.7%
—
$4.4M
WMT
$118.81
+6.7%
+11.3%
—
$11.1M
COST
$989.11
+4.5%
+10.6%
—
$3.8M
Data: official daily and weekly series for prices, yields and rates, refreshed every day; stock moves from daily closes; insider trades from SEC Form 4. Live pages: ODFL, KNX, JBHT, KR, WMT, COST.
What would change the picture
U.S. diesel moving above its 52-week high of $6.53 or back toward the low of $3.46; it is $6.18 now.
Shipping news from the Strait of Hormuz and the Red Sea: Brent reacts first. The Brent-WTI gap is $24.64; a narrowing gap would mean the shipping risk premium is easing.
Weekly U.S. crude inventories (Wednesdays): bigger-than-usual draws point to tighter supply.
The next Fed decision on 2026-10-28. Market odds: 85% hold, 1% cut, 14% hike.
These are the numbers and events to watch, not a forecast.
U.S. diesel today vs past years
When
Level then
Change to today
1 year ago (2025-10)
$3.71
+66.5%
3 years ago (2023-10)
$4.50
+37.4%
5 years ago (2021-10)
$3.59
+72.3%
10 years ago (2016-10)
$2.44
+152.8%
20 years ago (2006-10)
$2.51
+146.6%
Today's $6.18 is higher than 100% of all readings since 2001.
U.S. diesel: the last 10 years
Year
Average
High
Low
2026
$5.07
$6.53
$3.46
2025
$3.66
$3.87
$3.45
2024
$3.76
$4.11
$3.46
2023
$4.21
$4.63
$3.77
2022
$4.99
$5.81
$3.61
2021
$3.29
$3.73
$2.64
2020
$2.55
$3.08
$2.37
2019
$3.06
$3.17
$2.96
2018
$3.18
$3.39
$2.97
2017
$2.65
$2.93
$2.46
The highest reading since 2001 was $6.53 on 2026-09-21. The current year is partial.
Questions people also ask
What was the highest U.S. diesel in the past year?
U.S. diesel ranged from $3.46 to $6.53 over the past 12 months. The latest reading is $6.18 (2026-10-12).
How much has U.S. diesel changed in a year?
U.S. diesel is +66.5% from a year ago, +28.9% over three months and +3.6% over the past month.
Why is diesel more expensive than gasoline?
Diesel is $6.18 vs $4.33 for regular gasoline. Diesel competes with global demand from trucking, shipping, farming and heating, refiners get less of it per barrel, and it carries a higher federal tax (24.4 cents vs 18.4 cents a gallon).
Which related stocks did best this month?
Of the 6 companies tracked on this page, WMT did best over a month (+11.3%) and JBHT worst (-3.4%). No insider at these companies bought shares on the open market in the last 90 days.
Dates to watch
Date
Event
Why it matters
Mon Oct 19, 2026
Weekly retail gasoline and diesel prices
The national averages used on this page.
Wed Oct 21, 2026
Weekly U.S. crude oil inventories
Supply and demand check; moves oil prices the same day.
Wed Oct 21, 2026
KNX earnings
Companies on this page report results.
Wed Oct 28, 2026
Federal Reserve rate decision
Market odds: 85% hold, 1% cut, 14% hike.
Wed Oct 28, 2026
ODFL earnings
Companies on this page report results.
Wed Dec 9, 2026
Federal Reserve rate decision
Market odds: 21% hold, 2% cut, 77% hike.
Key terms on this page
Open-market trade
A purchase or sale on the exchange at the market price, paid with the insider's own money (code P or S on Form 4), as opposed to option exercises, grants or gifts.
52-week high / low
The highest and lowest daily closing price over the past year (about 252 trading days).
WTI
West Texas Intermediate, the U.S. benchmark crude oil, priced at Cushing, Oklahoma.
Brent
The international benchmark crude from the North Sea. It reflects seaborne oil, so it reacts more to shipping risk in the Strait of Hormuz and the Red Sea.
Barrel
42 U.S. gallons. Refining one barrel yields roughly 19-20 gallons of gasoline and 11-12 of diesel.
Federal funds rate
The overnight rate banks charge each other, which the Fed sets as a target range at its eight yearly meetings.
CPI
The Consumer Price Index, the main U.S. inflation measure, published monthly.
Where these numbers come from
U.S. diesel (weekly national average retail, $/gallon): official public data series, latest reading 2026-10-12.
WTI crude (daily spot, $/barrel): official public data series, latest reading 2026-10-14.
U.S. regular gasoline (weekly national average retail, $/gallon): official public data series, latest reading 2026-10-12.
Consumer prices (CPI, all items): official public data series, latest reading 2026-09-01.
Consumer prices (CPI, food): official public data series, latest reading 2026-09-01.
Changes compare the latest reading with the closest reading 7, 30, 91 and 365 days earlier; the 52-week range uses every reading in the past year.
Related stocks: daily closing prices and open-market insider trades from SEC Form 4 (last 90 days).
Every number on this page is computed from the data when the page is refreshed (usually daily); nothing is typed in by hand. This is information, not investment advice.
In the news
2026-10-17 · Another interest rate hike may be ahead as Fed battles inflation.
2026-10-17 · ExxonMobil Is Up 49% in 2026 With Brent Near $110. Here’s What the Stock Could Be Worth When Oil Cools.
2026-10-15 · 10-15-2026: Hot CPI and PPI, Yield Reversal, AI Angst + Staples Climb.
2026-10-15 · Treasury Yields Falls as AI Concerns Offset Faster Inflation Data.
2026-10-15 · BOJ board member Koeda: attention focused on price upside risks from yen depreciation and robust global AI demand, plus Middle East situation impact.
Short summaries of recent market headlines about these companies, their leaders and partners; not verified by CapitalSnitch.
See who's buying ODFL, KNX, JBHT, KR before the headlines.CapitalSnitch puts SEC insider trading, 13F fund ownership, Congress trades and the Fed meeting odds inside ChatGPT, Claude, Gemini, Grok and Copilot — ask "Which energy insiders are buying?" and get the answer with links to the filings. Free plan, no card; paid plans from $29/month.
How this article was made: it was generated from SEC filings and market data with automated tools and is published under Elise Bennett's editorial responsibility. Spotted an error? Tell us and we will correct it.
Sources: SEC EDGAR (Form 4, 8-K/6-K, prospectuses, XBRL share counts) and daily closing prices. Insider sales are often routine (taxes, diversification, pre-planned 10b5-1 plans). Not investment advice.
Free weekly email:the week's biggest insider buys and Congress trades, every Monday. No spam, one-click unsubscribe.